Gigabyte Z77X-UD3H Motherboard Review
Author: Dennis Garcia
Published: Tuesday, July 03, 2012
Benchmarks - Synthetic
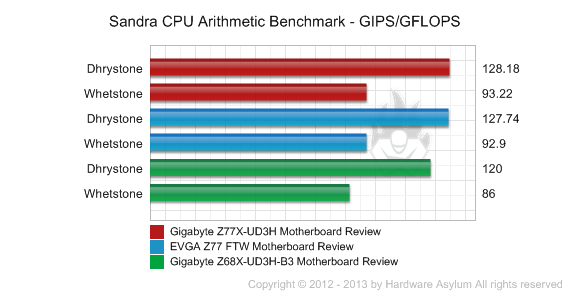
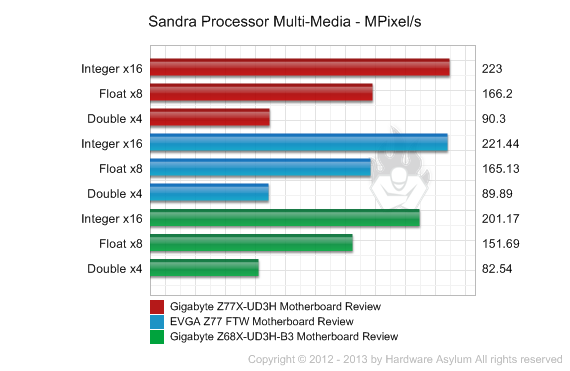
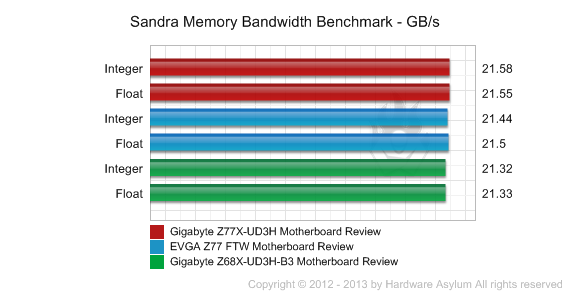
SiSoft Sandra
Sandra is a software collection of synthetic benchmarks that will give us a basic idea as to what a system is capable of. It should be noted that SiSoft numbers change depending on what version you have installed; these were recorded using Sandra Professional Version 17.25.2011.1
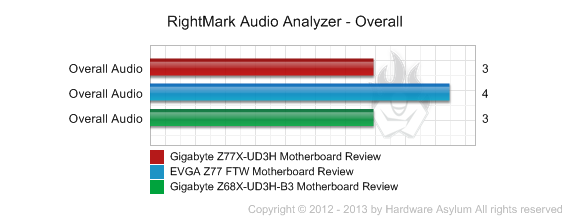
One of the most difficult things about doing reviews is finding some kind of common ground to establish a benchmark on so that when we say something is good our readers know it is based on something they can try themselves. In the cause of audio reproduction there are too many factors to consider such as hearing quality, sound equipment (speakers) and room dimensions so we are turning to the RightMark Audio Analyzer to give us a set of audio specs. We will then use those numbers to determine what kind of audio quality you can expect.
This test was performed using a loopback cable which is basically a jack that connects the analog line-out plug back into the analog line-in. That way we can remove almost all of the variables and concentrate on what is actually being reproduced and recorded.
Specs
Frequency response (from 40 Hz to 15 kHz), dB: +0.18, -0.18
Noise level, dB (A): -84.9
Dynamic range, dB (A): 84.8
THD, %: 0.180
THD + Noise, dB (A): -49.5
IMD + Noise, %: 0.364
Stereo crosstalk, dB: -82.9
IMD at 10 kHz, %: 0.338
General performance Good
Color coding indicates good to bad, Bright green = Excellent - Bright Red = Poor - Black = Good
Synthetic Conclusion
Synthetic performance never really tells the entire story, but is a good indication of what the system would probably be capable of doing under the right conditions. If you have been following the news of Ivy Bridge you will already know that the out of box performance is almost identical to a Sandy Bridge at the same speed. Despite this the Core i7 3770K is still a very powerful processor and is currently highly regarded in the overclocking world for its ability to scale under LN2.
The new Rightmark audio benchmark is a great tool for exposing audio specs for the various chips and software used and read much like if you were buying an amplifier or sound system for your house. What you can take away from this is that the sound quality is "good" for an onboard audio solution. We did color code some of the other numbers to give you an indication as to what each of the numbers mean.
The new Rightmark audio benchmark is a great tool for exposing audio specs for the various chips and software used and read much like if you were buying an amplifier or sound system for your house. What you can take away from this is that the sound quality is "good" for an onboard audio solution. We did color code some of the other numbers to give you an indication as to what each of the numbers mean.