Patriot Viper VP4300 PCI Express 4.0 NVMe M.2 SSD Review
Author: Dennis GarciaBenchmarks
EVGA Z590 Dark – Z590 Chipset
Intel Core i9 11900k (3.5Ghz) Octo Core 8 x 512KB L2 Cache 16MB L3 Cache
Thermaltake Water 2.0 Extreme
1x nVidia RTX 2080 Super
2x GSKill TridentZ PC4-330000 8GB DDR4 (19-19-19-39)
HP dvd1260i Multiformat 24x Writer
Thermaltake Toughpower Grand 1050 Watt PSU
Windows 10 Pro 64bit
Reference System
ASUS Maximux XII Hero – Z490 Chipset
Intel Core i9 10900k (3.7Ghz) Deca Core 10 x 32KB L2 Cache 10 x 256KB L3 Cache 20MB
Thermaltake Water 2.0 Extreme
1x nVidia RTX 2080 Super
2x GSKill TridentZ PC4-330000 8GB DDR4 (19-19-19-39)
HP dvd1260i Multiformat 24x Writer
Thermaltake Toughpower Grand 1050 Watt PSU
Windows 10 Pro 64bit
Storage Tested
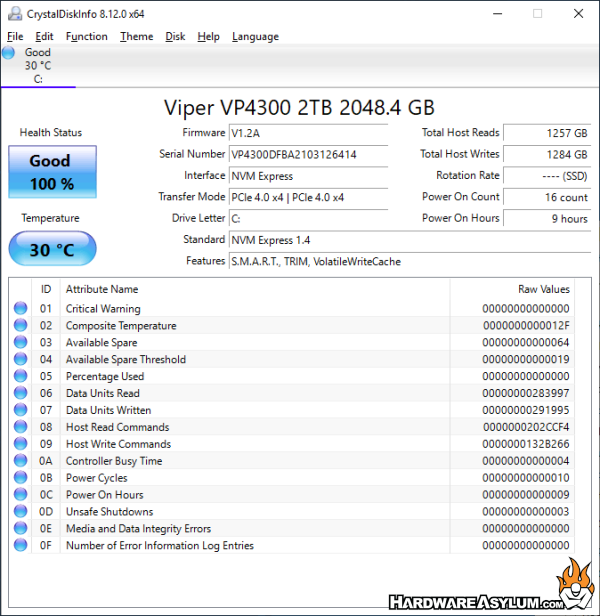
Patriot VP4300 2TB NVMe SSD @ PCIe 4.0 (On EVGA)
Patriot VP4300 2TB NVMe SSD @ PCIe 3.0 (On ASUS)
For the benchmarks I choose to give a mix of synthetic and real world tests that are both repeatable and should provide a good basis for comparison. The problem is knowing exactly what people are looking for when choosing a storage solution and if benchmarks really matter. While some sites might go into the timing ticks of the individual NAND chips or latency of the controller I find that to be a little too technical. (says the reviewer who benchmarks CPUs down to the thousands of a second)
Instead I find that my tests should allow readers to easily verify my results and decide for themselves if this product meets their needs.
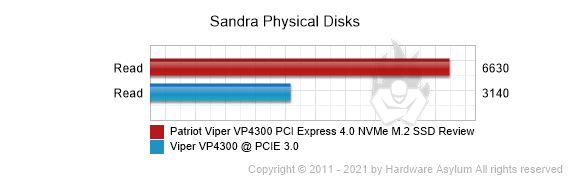
Sandra is a software collection of synthetic benchmarks that will give us a basic idea as to what a system is capable of. It should be noted that SiSoft numbers change depending on what hardware is being tested. These were recorded using Sandra Professional Version 31.14.2021.3
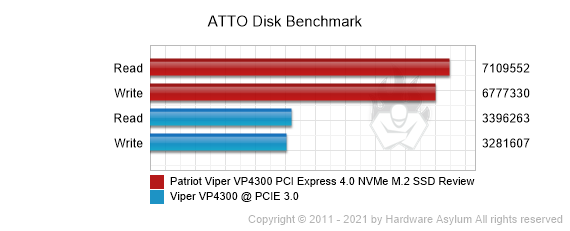
ATTO Disk Benchmark is a freeware disk benchmarking utility that can test a variety of storage solutions from single hard drives to multi level RAID arrays and solid state disks. The tests can be broken down to transfer sizes between 512B to 64MB with lengths between 64KB and 32GB. Testing results are shown on a transfer chart with reads and writes clearly marked.
For our benchmark the 64MB transfer is being recorded even though the 128k range is often quoted as having the fastest transfer speed (range) of any drive.
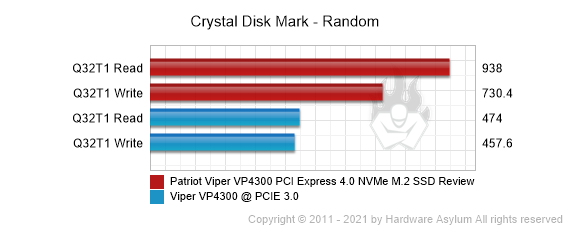
Crystal Disk Mark is a widely available disk benchmarking program that can test a variety of different scenarios from Sequential to Random with Multiple and Single queues.
For our tests the Sequential and Random test with multiple queues and threads will be recorded.

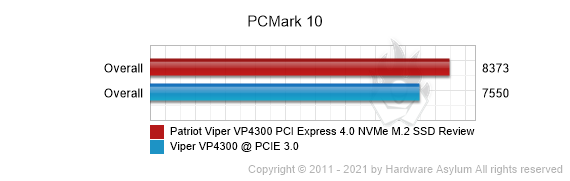
PCMark 10 is an overall system benchmark to measure and compare PC performance using real-world tasks and applications. Similar to 3DMark this new version tests the entire system as a whole using applications that reflect typical PC use in the home and at the office. This approach ensures that PCMark measures the things that matter, highlighting performance differences that will be apparent to end users and consumers.
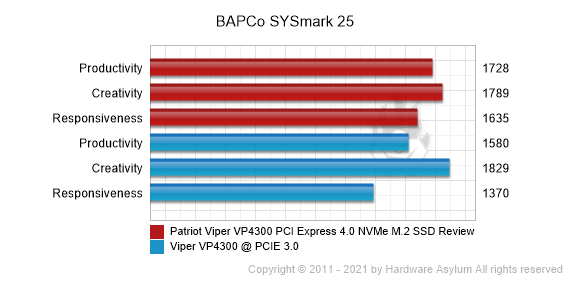
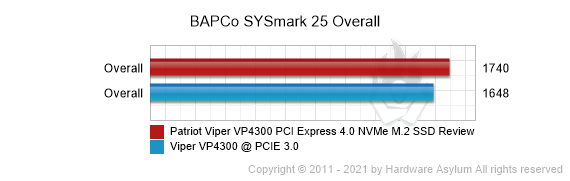
SYSmark 25 is an application-based benchmark that reflects usage patterns of business users in the areas of Productivity, Creativity and Responsiveness. The new Productivity Scenario has updated workloads and applications geared towards office centric user activities. The new Creativity Scenario features updated workloads and applications geared toward media-centric user activities. The new Responsiveness Scenario models ‘pain points’ in the user experience. These common activities that include: application launches, file launches, web browsing with multiple tabs, multi-tasking, and background application installation.
These benchmarks show an interesting cross section. On the synthetic side you can clearly see how the Viper VP4300 walks away with the best results. Honestly this should be no surprise as it is the fastest drive of the sample set and recorded using PCI Express 4.0.
I thought it would be most interesting to see the speed difference between PCI Express 3.0 vs PCI Express 4.0 when it comes to storage. My 10-Core Core i9 10900k should offer better overall performance but when you factor in storage the smaller 8-Core Core i9 11900k can be faster. This is clearly illustrated in the BAPCo SYSmark 25 benchmark with a clear win in Creativity due to the processor and a major loss in Productivity and Responsiveness due to the faster storage subsystem.